KPI Dashboards for COOs That Update in Real Time With Smart Healthcare Reports
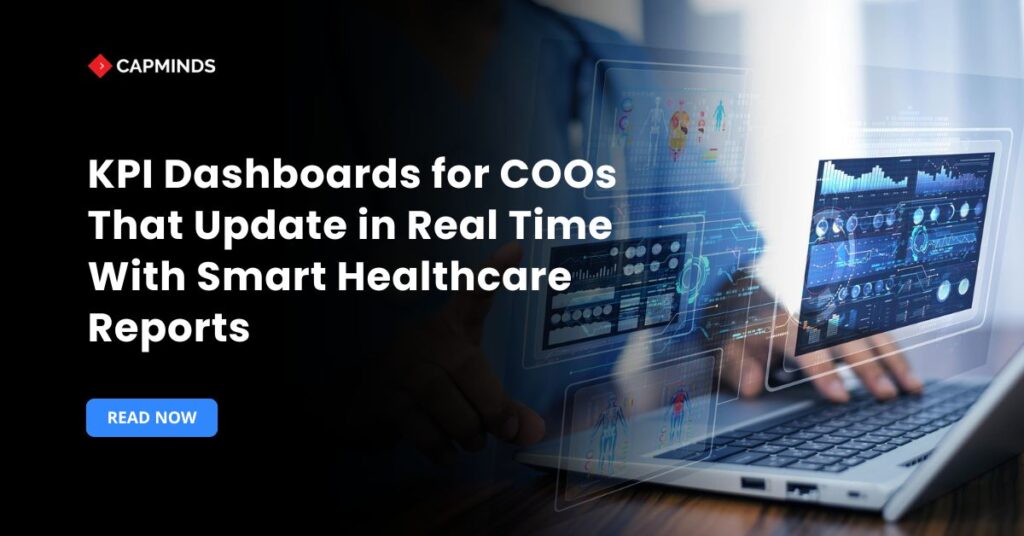
Chief operating officers in health‑care organizations have to make rapid decisions across clinical, operational, and financial domains. They often struggle with separated data, clinical systems, HR applications, supply‑chain tools, and financial records that seldom talk to each other. When data are delayed or incomplete, executives rely on outdated spreadsheets or manual reports, which slows down decisions and can compromise patient care.
The solution is a real‑time KPI dashboard that pulls data from multiple sources, updates automatically, and presents it in actionable, role‑specific views. When enhanced with healthcare reports, these dashboards give COOs the ability to monitor outcomes, anticipate problems, and align operations with the organization’s strategic goals.
Why Real‑Time Matters to Healthcare COOs
Modern healthcare operations are fast‑moving and data‑intensive. Disparate data gaps across departments hinder a COO’s ability to get real‑time, actionable information. COOs need an IT solution that fetches data from all systems and provides a real‑time, 360‑degree view of the hospital’s performance.
Real‑time dashboards remove manual bottlenecks and ensure that key performance indicators are error‑free. They also support mobile access so busy executives can check metrics on the go.
- Automating dashboards to update in real time is essential for agility.
- Real‑time KPI automation is the continuous updating and monitoring of KPIs without manual intervention.
- Automation tools gather data from disparate systems, analyze it, and present it in an accessible format.
The main benefits include immediate access to current metrics, reduced manual workload, and improved decision accuracy. A real‑time dashboard, therefore, becomes a “nerve center” of insight that enables proactive management rather than retrospective analysis.
Key KPIs Healthcare COOs Should Monitor
KPI dashboards are most valuable when they focus on metrics that align with strategic goals.
| KPI Category | Example KPIs | Why They Matter |
| Clinical | Hospital incidents, post‑operative mortality rates, patient satisfaction scores, and hospital‑acquired infection rates | These KPIs provide a snapshot of the quality of care and patient safety. For instance, tracking hospital‑acquired infections highlights problem areas so COOs can enforce protocols. Patient satisfaction scores and courtesy ratings show whether operational decisions are improving patient experience. |
| Operational | Patient wait times, medication errors, average length of stay, bed/utilization rates, staffing levels | Monitoring wait times allows COOs to identify bottlenecks and redeploy staff. ALOS provides insights into patient throughput and cost efficiency, while bed and equipment utilization reveal whether assets are overused or idle. |
| Financial | Payor performance, revenue per physician, profit margin, accounts receivable aging, expense ratios | Financial KPIs highlight the health system’s revenue cycle and profitability. COOs can benchmark reimbursement performance, detect aging accounts receivable, and determine which payor contracts need renegotiation. Monitoring revenue and costs per physician ensures that clinical productivity aligns with financial goals. |
| Patient Outcomes | Readmission rate, mortality rate, preventive‑care uptake, chronic‑disease metrics such as HbA1c for diabetes | Dashboards that track readmissions and mortality rates provide a real‑time picture of clinical effectiveness. Tracking preventive‑care uptake and disease‑specific outcomes helps COOs support programs that improve long‑term health. |
| Resource Utilization | Staff productivity metrics, operating room utilization, supply‑chain turnover, and queue‑level metrics in call centers | Executive dashboards can display physician productivity. Similarly, dashboards can monitor call‑center performance to improve patient access. Monitoring OR utilization helps optimize surgery schedules and reduce downtime. |
| Revenue Cycle | Accounts receivable days, claim denial rate, billing turnaround time, and collection rates | GoodData’s financial dashboards track revenue cycle metrics to ensure healthy cash flow. These KPIs help COOs identify delays in billing, reduce denied claims, and improve collections. |
| Cost of Care | Cost per patient, overhead costs, cost per procedure, supply, and medication expenses | Monitoring cost per patient and cost per procedure allows leaders to identify inefficiencies and allocate resources more effectively. ThoughtSpot stresses the importance of tracking cost per procedure to find cost‑saving opportunities. |
Related: Custom Dashboards vs. Off-the-Shelf BI in Healthcare: What Does Your Organization Need?
Integrating Real‑Time Data and Healthcare Reports Into Dashboards
Creating a real‑time dashboard for COOs isn’t just about visualizing metrics; it’s about building an ecosystem that automatically pulls, analyzes, and presents data from disparate systems.
1. Identify and Prioritize KPIs
- Collaborate with stakeholders to define the KPIs that matter most for clinical, operational, and financial goals.
- Focus on actionable metrics rather than vanity data and ensure each KPI has a clear owner and defined benchmark.
2. Choose a Real‑Time Platform
- Select tools that support dynamic data integration and real‑time visualization.
- Platforms like Power BI or Google Data Studio are used for real‑time updates, while many healthcare systems use EHR or BI platforms with embedded dashboards.
- Ensure the platform supports mobile access and role‑based customization.
3. Integrate Data Sources Seamlessly
- Connect EHRs, lab systems, and billing software to your dashboard.
- Building connections between all relevant data sources and setting up automation scripts to refresh data at regular intervals.
- Custom EHR dashboards can combine data from patient visits, billing, staff performance, and treatment outcomes.
4. Automate the Refresh and Alerts
- Configure automation processes to continually ingest data and trigger alerts when KPIs deviate from benchmarks.
- A rule engine for configuring alerts, escalations, and decision support within dashboards.
- Alerts can include hyperlinks back to source systems for rapid action.
5. Enable Drill‑Down and Predictive Analytics
- A well‑designed dashboard should allow users to drill down into individual KPIs and view details by department, specialty, or facility.
- Trend analysis and predictive modeling can suggest likely events and recommend adjustments to meet targets.
- For example, predictive analytics might forecast patient admissions during flu season, helping COOs allocate staff proactively.
6. Integrate Healthcare Reports for Granular Insights
- Aggregate data from healthcare reports at the population level to monitor chronic disease prevalence and risk profiles.
- Use color‑coded indicators from individual reports to highlight patient groups needing intervention.
- Provide interactive links from summary KPIs to underlying healthcare reports so executives can explore individual health stories when necessary.
7. Design for Usability and Collaboration
- Dashboards should be intuitive, visually appealing, and accessible across devices.
- COO dashboards emphasize turning KPIs into simplified narratives, ensuring users aren’t overwhelmed by numbers.
- Collaboration features allow team members to provide input during dashboard creation and data interpretation.
Related: How Custom EHR Dashboards and Reporting Tools Help You Make Data-Driven Decisions
Unlock Real-Time Operational Excellence With CapMinds Solution
Transform the way your healthcare organization operates with CapMinds’ advanced digital health tech services. Our custom solutions empower COOs with real-time KPI dashboards and healthcare reporting tools tailored for fast, informed decisions.
Whether you’re looking to unify fragmented data, automate performance tracking, or gain insights from Healthcare Reports, we’ve got you covered:
- Custom Healthcare Analytics Dashboard Development
- Real-Time BI Dashboard Solutions with Healthcare Report Integration
- EHR, Lab, and RCM System Integration for Seamless Data Flow
- Mobile-Ready Dashboards for Executives On-the-Go
- Predictive & Drill-Down Analytics for Proactive Decision-Making
- Healthcare Reports for Population-Level Clinical Insights
At CapMinds, we don’t just build dashboards; we build intelligence systems that help healthcare leaders see, act, and lead with clarity. Ready to centralize your hospital’s KPIs into one intelligent dashboard?
Contact CapMinds and take control of your healthcare operations.